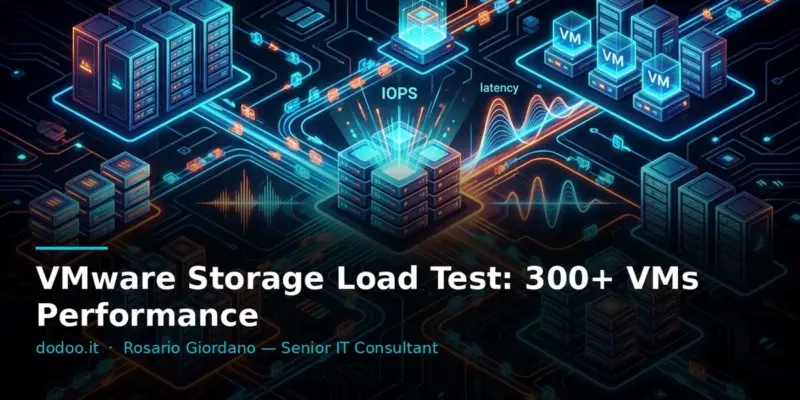
When dealing with complex IT infrastructures, storage reliability is a fundamental pillar. I’ve managed the migration of over 300 VMware virtual machines in an enterprise environment, and the most critical phase wasn’t the migration itself, but the storage load test. This rigorous testing, which could have halted our progress, proved to be the key to ensuring the infrastructure could handle the production load without failure.
Theory is one thing, practice is another. Vendor specifications provide a starting point, but operational reality, with its unpredictable peaks and heterogeneous workloads, demands field testing. The stakes were high: a storage slowdown would impact thousands of users, compromising essential services. For this reason, we approached the load test with utmost rigor, transforming a potential disaster into an operational success. Read also: VMware to Proxmox: Initial Assessment for Public Sector
Tested on: VMware vSphere 7.0 · vSAN 7.0 · Iometer 1.1.0 · fio 3.34 · September 2026
Prerequisites and Test Environment
For an effective load test, it’s essential to replicate the production environment as closely as possible. This includes not only the target storage but also an adequate network and a sufficient number of virtual machines or physical servers to act as load generators. In our case, we used a VMware vSphere 7.0 cluster with vSAN storage. We configured several dedicated VMs to generate the load, distributing them across various hosts to simulate realistic usage.
The choice of tools is crucial. To generate IOPS and measure latency, we relied on Iometer, a de facto standard in the Windows world, and fio (Flexible I/O Tester) for Linux environments. Both allow granular configuration of I/O patterns, including random/sequential blocks, read/write ratios, and queue depth, which are fundamental elements for simulating real-world loads from databases, file servers, or VDI desktops.
1. Defining Workloads and Test Scenarios
The first step was to identify the most critical workloads and define test scenarios that reflected their behavior. Not all VMs generate the same type of I/O. For example, an Oracle database has a very different I/O profile from a web server or a virtual desktop.
We categorized our 300+ VMs based on their I/O profile:
- High I/O VMs (Databases): Primarily small block random writes, high queue depth.
- Medium I/O VMs (File Servers, Applications): Mix of reads/writes, variable block sizes.
- Low I/O VMs (Web Servers, Light VDI Desktops): Primarily reads, small blocks, low queue depth.
For each category, we defined a specific I/O profile to replicate with Iometer or fio. For instance, for a database, we might use a profile with a significant proportion of random writes, 8KB blocks, and a queue depth of 32. Read also: PostgreSQL Replica Lag: Monitor Across Data Centers
2. Executing Load Tests with Iometer and fio
Once the profiles were defined, we configured the load-generating VMs. For Iometer, we created configuration files (.icf) that defined the workers, I/O targets, and specific patterns. For fio, we used equally detailed .fio configuration files.
Example fio configuration for testing random writes on a virtual disk:
[global]
ioengine=libaio
iodepth=32
rw=randwrite
bs=8k
direct=1
numjobs=4
time_based
runtime=300

[test_db_write]
filename=/dev/sdb
size=10G
We then launched the tests sequentially and in parallel, carefully monitoring the performance metrics of the storage and VMware hosts. It’s crucial to run tests for a sufficient duration (at least 30 minutes, ideally hours) to stabilize results and identify any anomalous behavior under prolonged load.
3. Analyzing Real-World Graphs and Identifying Bottlenecks
Performance graphs were our compass. We primarily monitored:
- IOPS (Input/Output Operations Per Second): The number of I/O operations completed per second. A high value is generally positive but must be balanced with latency.
- Latency (ms): The average time taken for an I/O operation to complete. This is the most critical parameter for user experience. Values above 10-20ms for mission-critical workloads are unacceptable.
- Throughput (MB/s): The amount of data transferred per second. Important for sequential loads (e.g., backups).
We cross-referenced data from Iometer/fio with vCenter Server graphs. Storage latency graphs (Datastore Latency, Device Latency) were particularly revealing. When latency dramatically increased while IOPS remained constant or decreased, it was a clear sign of a bottleneck.
To get latency information for a single storage device directly from an ESXi host, you can use the command:
esxcli storage core device latency get -d naa.xxxxxxxxxxxxxxxxxxxxThis command provides aggregated latency for the specified device, useful for isolating issues at the LUN or physical disk level. Read also: Monitoring: Uptime Kuma vs Zabbix for Small Orgs
4. Infrastructure Optimization and Tuning
The analysis revealed that the bottleneck wasn’t the physical storage itself, but suboptimal storage network configuration and certain VM parameters. For example, we discovered that increasing the HBA (Host Bus Adapter) queue depth and optimizing iSCSI or Fibre Channel drivers significantly improved performance.
Other optimizations included:
- Partition Alignment: Ensuring VM partitions are correctly aligned to avoid I/O penalties.
- Thin Provisioning vs Thick Provisioning: Evaluating the impact on performance and space management.
- Storage I/O Control (SIOC): Utilizing VMware SIOC to prioritize I/O for the most critical VMs during peak times.
- Storage Cache: Optimizing caching policies at the storage array level.
Common Errors and Troubleshooting
One of the most common errors is not separating workloads. Testing only with a generic load can lead to misleading results. Another mistake is not considering the impact of the storage network; a saturated network can mask undersized storage. It’s fundamental to monitor every component in the I/O chain, from the application to the physical array.
During testing, we encountered inexplicable latency spikes. After in-depth analysis, we discovered they were caused by excessive resource sharing on a single vSwitch for iSCSI traffic. Separating traffic onto dedicated vSwitches resolved the issue, demonstrating how incorrect network configuration can directly impact storage performance.
FAQ — Frequently Asked Questions
What is an acceptable latency value for storage in a VMware environment?
For general workloads, latency below 20ms is usually acceptable. For databases or high-performance applications, the goal is typically below 5-10ms. Consistently higher values indicate a performance problem that must be investigated and resolved to prevent application slowdowns or outages.
Do I need to test every single VM?
No, it’s not necessary. It’s more efficient to categorize VMs by I/O profile (e.g., databases, file servers, VDI) and test a representative sample from each category, then scale the results for the entire environment. This approach reduces the time and resources needed for testing while still providing reliable data for planning.
What happens if tests reveal that the storage is insufficient?
If tests indicate that the storage cannot sustain the anticipated load, it’s crucial not to proceed with the migration. Options include optimizing the existing array (e.g., adding cache, faster disks), redesigning data distribution, or purchasing additional storage. Ignoring these signals would lead to severe performance issues in production.
How often should I perform storage load tests?
Comprehensive load tests are recommended before major migrations, significant storage upgrades, or the introduction of new intensive workloads. However, continuous monitoring of I/O metrics is essential to detect performance degradations over time and intervene proactively, preventing problems before they become critical.
Conclusions with Operational Takeaways
Storage load testing is not optional; it’s a critical phase in managing complex virtualized infrastructures. In our case, in-depth analysis of latency and IOPS graphs, combined with robust testing tools like Iometer and fio, allowed us to proactively identify and resolve bottlenecks, ensuring that over 300 VMs migrated to a robust and high-performing storage infrastructure. Ignoring this phase means gambling with service stability and availability. The operational lesson is clear: test, measure, analyze, and optimize, always.
Sources
Updated: September 2026