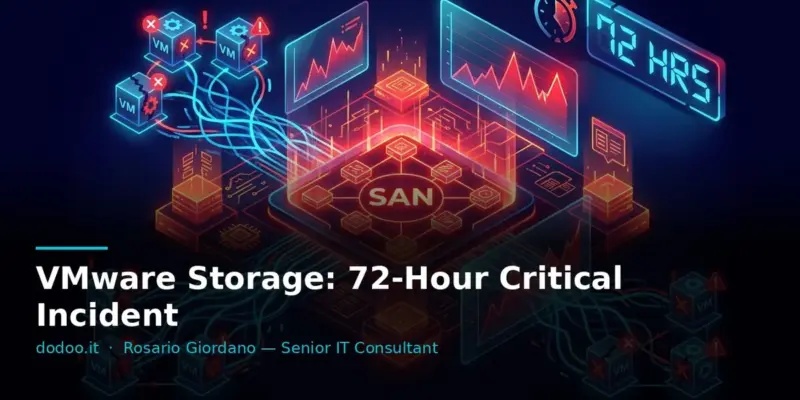
When critical infrastructure grinds to a halt, every minute counts. In an enterprise environment with hundreds of virtual machines, a storage issue can rapidly escalate into an operational disaster. I personally experienced a storage incident that crippled an entire organization for seventy-two hours, transforming a Friday afternoon into a troubleshooting odyssey. The chronology of those events, analyzed minute-by-minute through graphs and logs, offers a valuable lesson in resilience and proactive monitoring. This wasn’t a sudden failure, but a progression of degradation that, if not intercepted in time, can have devastating consequences for business continuity. The goal of this analysis is not just to understand what happened, but more importantly, how to prevent it from happening again, by equipping ourselves with the right tools and procedures to identify and resolve anomalies before they become crises. Read also: VMware Storage Load Test: 300+ VMs Performance
Tested on: VMware vSphere 7.0 U3 · Dell EMC Unity XT 480F · September 2026
Prerequisites / Test Environment
The environment in question consisted of a VMware vSphere 7.0 U3 cluster with 8 ESXi hosts, approximately 350 virtual machines, and a Dell EMC Unity XT 480F Storage Area Network (SAN). The SAN was configured with a pool of SAS drives and an SSD cache tier. Monitoring was handled by vRealize Operations Manager and the SAN’s native management tools. iSCSI connectivity was managed via two Cisco Nexus switches with multi-pathing configured on all hosts.
The Seventy-Two Hours: Minute-by-Minute Storage Metrics
Friday, Day 1: The Silent Onset of Degradation
The incident began on a Friday afternoon, around 3:00 PM. The initial signs were subtle: a slight increase in I/O latency on some datastores. vRealize Operations graphs showed an increase in average latency from 5ms to about 20ms, still within acceptable limits, but a red flag for a typically stable environment.
esxcli storage core adapter list -A vmhbaX | grep -i "latency"This command, executed on the ESXi hosts, could have revealed an increase in latency at the HBA level, but at that moment, the degradation was still at the logical datastore level. Attention was focused on a peak of activity on a crucial SQL Server database, which seemed to be the cause of the temporary slowdown.
Saturday, Day 2: The Problem Accelerates
Throughout Friday night and Saturday morning, the situation worsened. Average latency climbed to 100ms, with sporadic peaks of 300-400ms. The first vRealize Operations Manager alerts began to trigger, signaling ‘High Disk Latency’ on several datastores. Remote users started reporting significant application slowdowns.
Analysis of the SAN graphs revealed a critical anomaly: write cache saturation. Cache utilization was consistently high, with periods of complete saturation. This indicated that the SAN was unable to flush the cache quickly enough, forcing I/O requests to be written directly to the much slower disks. Read also: vSphere Pre-Migration Script: Avoid Surprises
# Example command to check cache status on a Dell EMC SAN (via CLI)
# (Exact syntax varies by vendor and model)
svc_diag --cache_stats
Sunday, Day 3: Crisis Peak and Restoration
By Sunday morning, the situation was untenable. Average latency consistently hovered above 500ms, with peaks exceeding 1500ms. Many VMs were stalled, some had disconnected from the datastore, and vCenter itself showed signs of instability due to the impact on its own storage. Production was effectively halted.
The intervention required drastic action: identifying and temporarily pausing the VMs with the highest I/O load to allow the SAN cache to clear. This alleviated pressure, and latency gradually began to decrease. Concurrently, a thorough analysis of the SAN logs revealed an issue with a disk group that, while not ‘faulty,’ had lower-than-expected throughput, contributing to cache saturation. The solution involved redistributing LUNs and optimizing caching policies, in addition to a SAN firmware update.
# Example command to identify high I/O VMs on an ESXi host
# (to be run in esxtop or PowerCLI for more detailed analysis)
esxtop -b -a | grep "VMName" | grep "DS_LATENCY"
Common Errors and Troubleshooting
One common error is focusing solely on overall latency, ignoring more specific metrics like cache utilization or throughput per LUN. Another mistake is failing to correlate vCenter logs with SAN logs. Often, the problem isn’t within a single component, but in the interaction between them.
Troubleshooting tip: If you encounter abnormal latencies, always start at the lowest level: the physical disks of the SAN. Check disk status, controller throughput, and cache utilization. Then move up: LUNs, datastores, ESXi hosts, and finally individual VMs. Each layer adds complexity, but also observation points. Ensure multi-pathing is correctly configured and that there are no errors in the I/O paths. Read also: MFA Admin: Unblocking Operations
FAQ — Frequently Asked Questions
How can I proactively monitor SAN cache?
Many SANs offer native monitoring tools or plugins for systems like vRealize Operations. It’s crucial to configure alerts for cache utilization thresholds (e.g., for warning, for critical) and not just for latency. This allows for intervention before the cache completely saturates, preventing performance degradation.
What is the difference between average latency and latency peaks?
Average latency is a general indicator, but latency peaks are often the true culprits of performance degradation. A high peak, even if brief, can temporarily block an application or a database. It’s important to monitor both values and set specific alerts for peaks, which can indicate transient but impactful problems.
How often should I analyze storage performance graphs?
In a critical environment, a quick daily review of trends is advisable. A more in-depth analysis, perhaps weekly or monthly, can help identify usage patterns and plan upgrades or optimizations. During an incident, analysis must be continuous and real-time, correlating all available data.
Can multi-pathing cause latency issues?
If misconfigured, yes. Unbalanced or erroneous multi-pathing can direct all I/O traffic over a single path, saturating it and causing latency. It is essential to verify multi-pathing configuration on ESXi hosts and ensure all paths are active, functional, and balanced. Read also: Healthcare: DR and BC, Regulations Ask What
Conclusions with Operational Takeaways
The seventy-two hours of this storage incident highlighted that true resilience is not limited to having redundant hardware, but includes granular and proactive monitoring of every component, from SAN cache to individual VM latency. The ability to correlate data from various sources (vCenter, SAN, application logs) was crucial for diagnosing the problem. The most important operational takeaway is to invest in advanced monitoring tools and define alert thresholds not only for the symptom (high latency) but also for the potential cause (cache saturation). Only then can an incident be transformed into a learned lesson, strengthening the infrastructure for the future.
Sources
Updated: September 2026